Three White Soldiers Pattern in Trading – Get All The Info
Key Takeaways:
The Three White Soldiers pattern is a bullish indicator suggesting a potential reversal of a downtrend on a chart.
Three consecutive long-bodied candlesticks characterize it, signalling bullish momentum in the financial markets.
The contrasting pattern, Three Black Crows, indicates a bearish trend, highlighting the dynamic nature of stock market patterns.
Understanding these patterns and tools like RSI and moving averages can significantly enhance trading decisions
Have you recently considered what the three white soldiers’ pattern in trading means? Why is it important to understand this candlestick pattern to improve your trading and overall success? Are there any particular trading strategies or other technical indicators to help you achieve your goals?
Whether you’re a novice trader or you do have some relevant experience in this volatile industry and financial markets, there’s a lot to talk about regarding the three white soldiers pattern, what is Relative Strength Index (RSI), terms such as moving averages, three black crows, and much more!
But, before we get to all that, let’s see all about this pattern, shall we?
What is the Three White Soldiers Pattern exactly?
The Three White Soldiers represent a bullish indicator hinting at a possible reversal of a prevailing downtrend on a chart. Three consecutive lengthy candlesticks highlight this optimistic formation.
Each candle should start and end higher than the previous one, staying within its body. Minimal shadows on these candlesticks are desirable, and it’s best if each one begins within the body of the preceding candle.
Is the Three White Soldiers pattern considered bullish?
Yes, the Three White Soldiers is a bullish indicator in trading. It signals a potential end to a downward trend.
This pattern features three straight long candles, each opening within the previous one’s body and closing higher than the previous one’s peak.
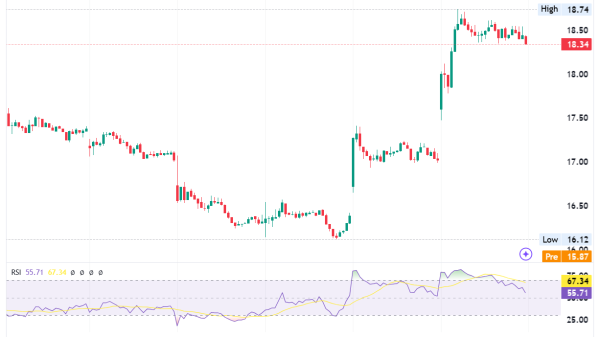
Example of the Three White Soldiers candlestick pattern
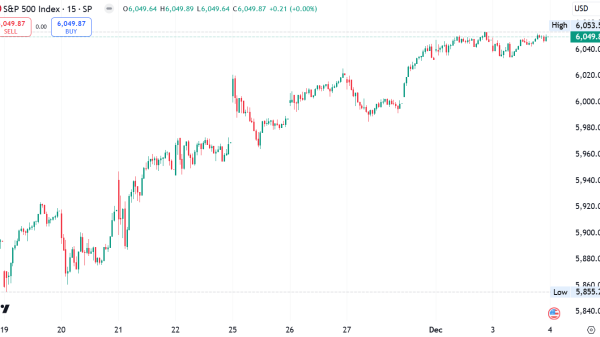
The Three White Soldiers pattern, visible on candlestick charts, is a bullish signal in the financial markets. Appearing on price charts, this pattern alerts traders to potential bullish price action. Those shorting might consider exiting, while others may view it as an entry point.
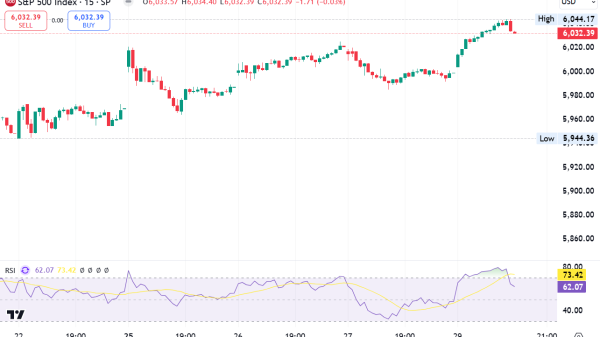
The swift upward movement can lead to overbought scenarios, with indicators like the RSI possibly exceeding 70.0. Over time, brief consolidations might occur, but with exponential moving averages and trendlines suggesting a bullish trend.
The ascent might hit resistance points, causing pauses in the climb. Incorporating stop losses becomes key to managing risks amidst these reversal patterns.
What Do the Three White Soldiers Reveal?
The Three White Soldiers is a pattern that shows a big increase in a stock, commodity, or pair on a chart. When candles have little to no shadows, bullish forces are strong. Over three continuous sessions, the bulls drive prices close to daily highs.
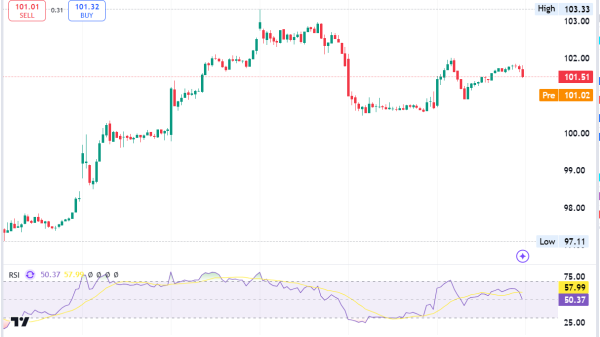
Before this, the ETF saw a bearish trend. The Three White Soldiers signalled a bullish breakout. This trendline may suggest a sustained rally, but traders should be wary.
The asset could be near a resistance, hinting at consolidation or overbought. The volume of the breakout is also crucial: a low-volume breakout may need to be more trustworthy. Traders should weigh all factors before deciding.
Three White Soldiers Vs. Three Black Crows in the Stock Market
In the stock market’s time frame, the Three White Soldiers and the Three Black Crows stand out as contrasting candlestick patterns. The Three Black Crows pattern consists of three successive long-bodied candlesticks.
Each opens within the candle’s body before and closes lower than its predecessor. On the other hand, the Three White Soldiers indicate a bullish shift over a period of time.
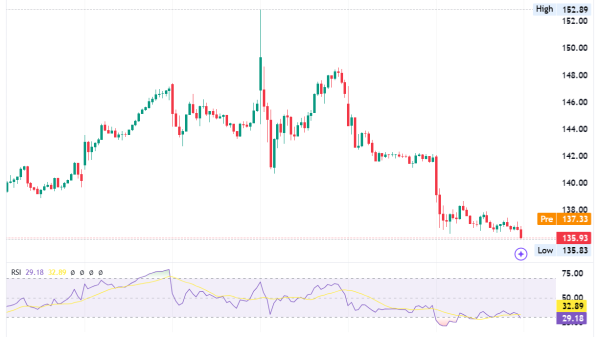
While the Three White Soldiers suggest a bullish momentum transition, the Three Black Crows signal the bears asserting dominance. It’s essential to consider the offers available in the marketplace and understand how these patterns impact how and where listings appear.
Moreover, the importance of volume and the necessity for added confirmation remain constant for both patterns.
Bottom line
The Three White Soldiers chart pattern is a robust bullish signal, indicating a potential reversal from a downward trend.
Understanding this pattern helps traders make smart decisions and improve their positions in the changing financial markets. Utilizing this knowledge can be a valuable asset to novice and seasoned traders.
The post Three White Soldiers Pattern in Trading – Get All The Info appeared first on FinanceBrokerage.


